top of page

Unlock the potential of the most powerful long-term wealth building strategy
Identifying trend changes of the Dow-to-Gold Ratio using the MACD Indicator
GOLD-TO-PLATINUM RATIO CHARTS
Gold-to-Platinum Ratio Charts - Summary
The Long-Term Trend (Monthly values) is moving sideways, with weakening negative momentum. Closing Value (April 30): 2.32.
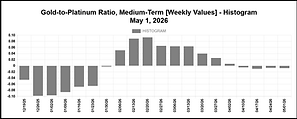
The Medium-Term Trend (Weekly values) is moving sideways, with very weak negative momentum. Closing Value (May 1): 2.32.
The Short-Term Trend (Daily values) shows signs of starting to decrease, with very weak positive momentum. Closing Value (May 1): 2.32.
Monthly values April 2026 (long-term trend)
Gold-to-Platinum Ratio & Moving Averages

MACD & Signal Line

Histogram

Weekly values May 1, 2026 (medium-term trend)

Gold-to-Platinum Ratio & Moving Averages

MACD & Signal Line
Histogram
Daily values May 1, 2026 (short-term trend)
Gold-to-Platinum Ratio & Moving Averages

MACD & Signal Line


Histogram
bottom of page